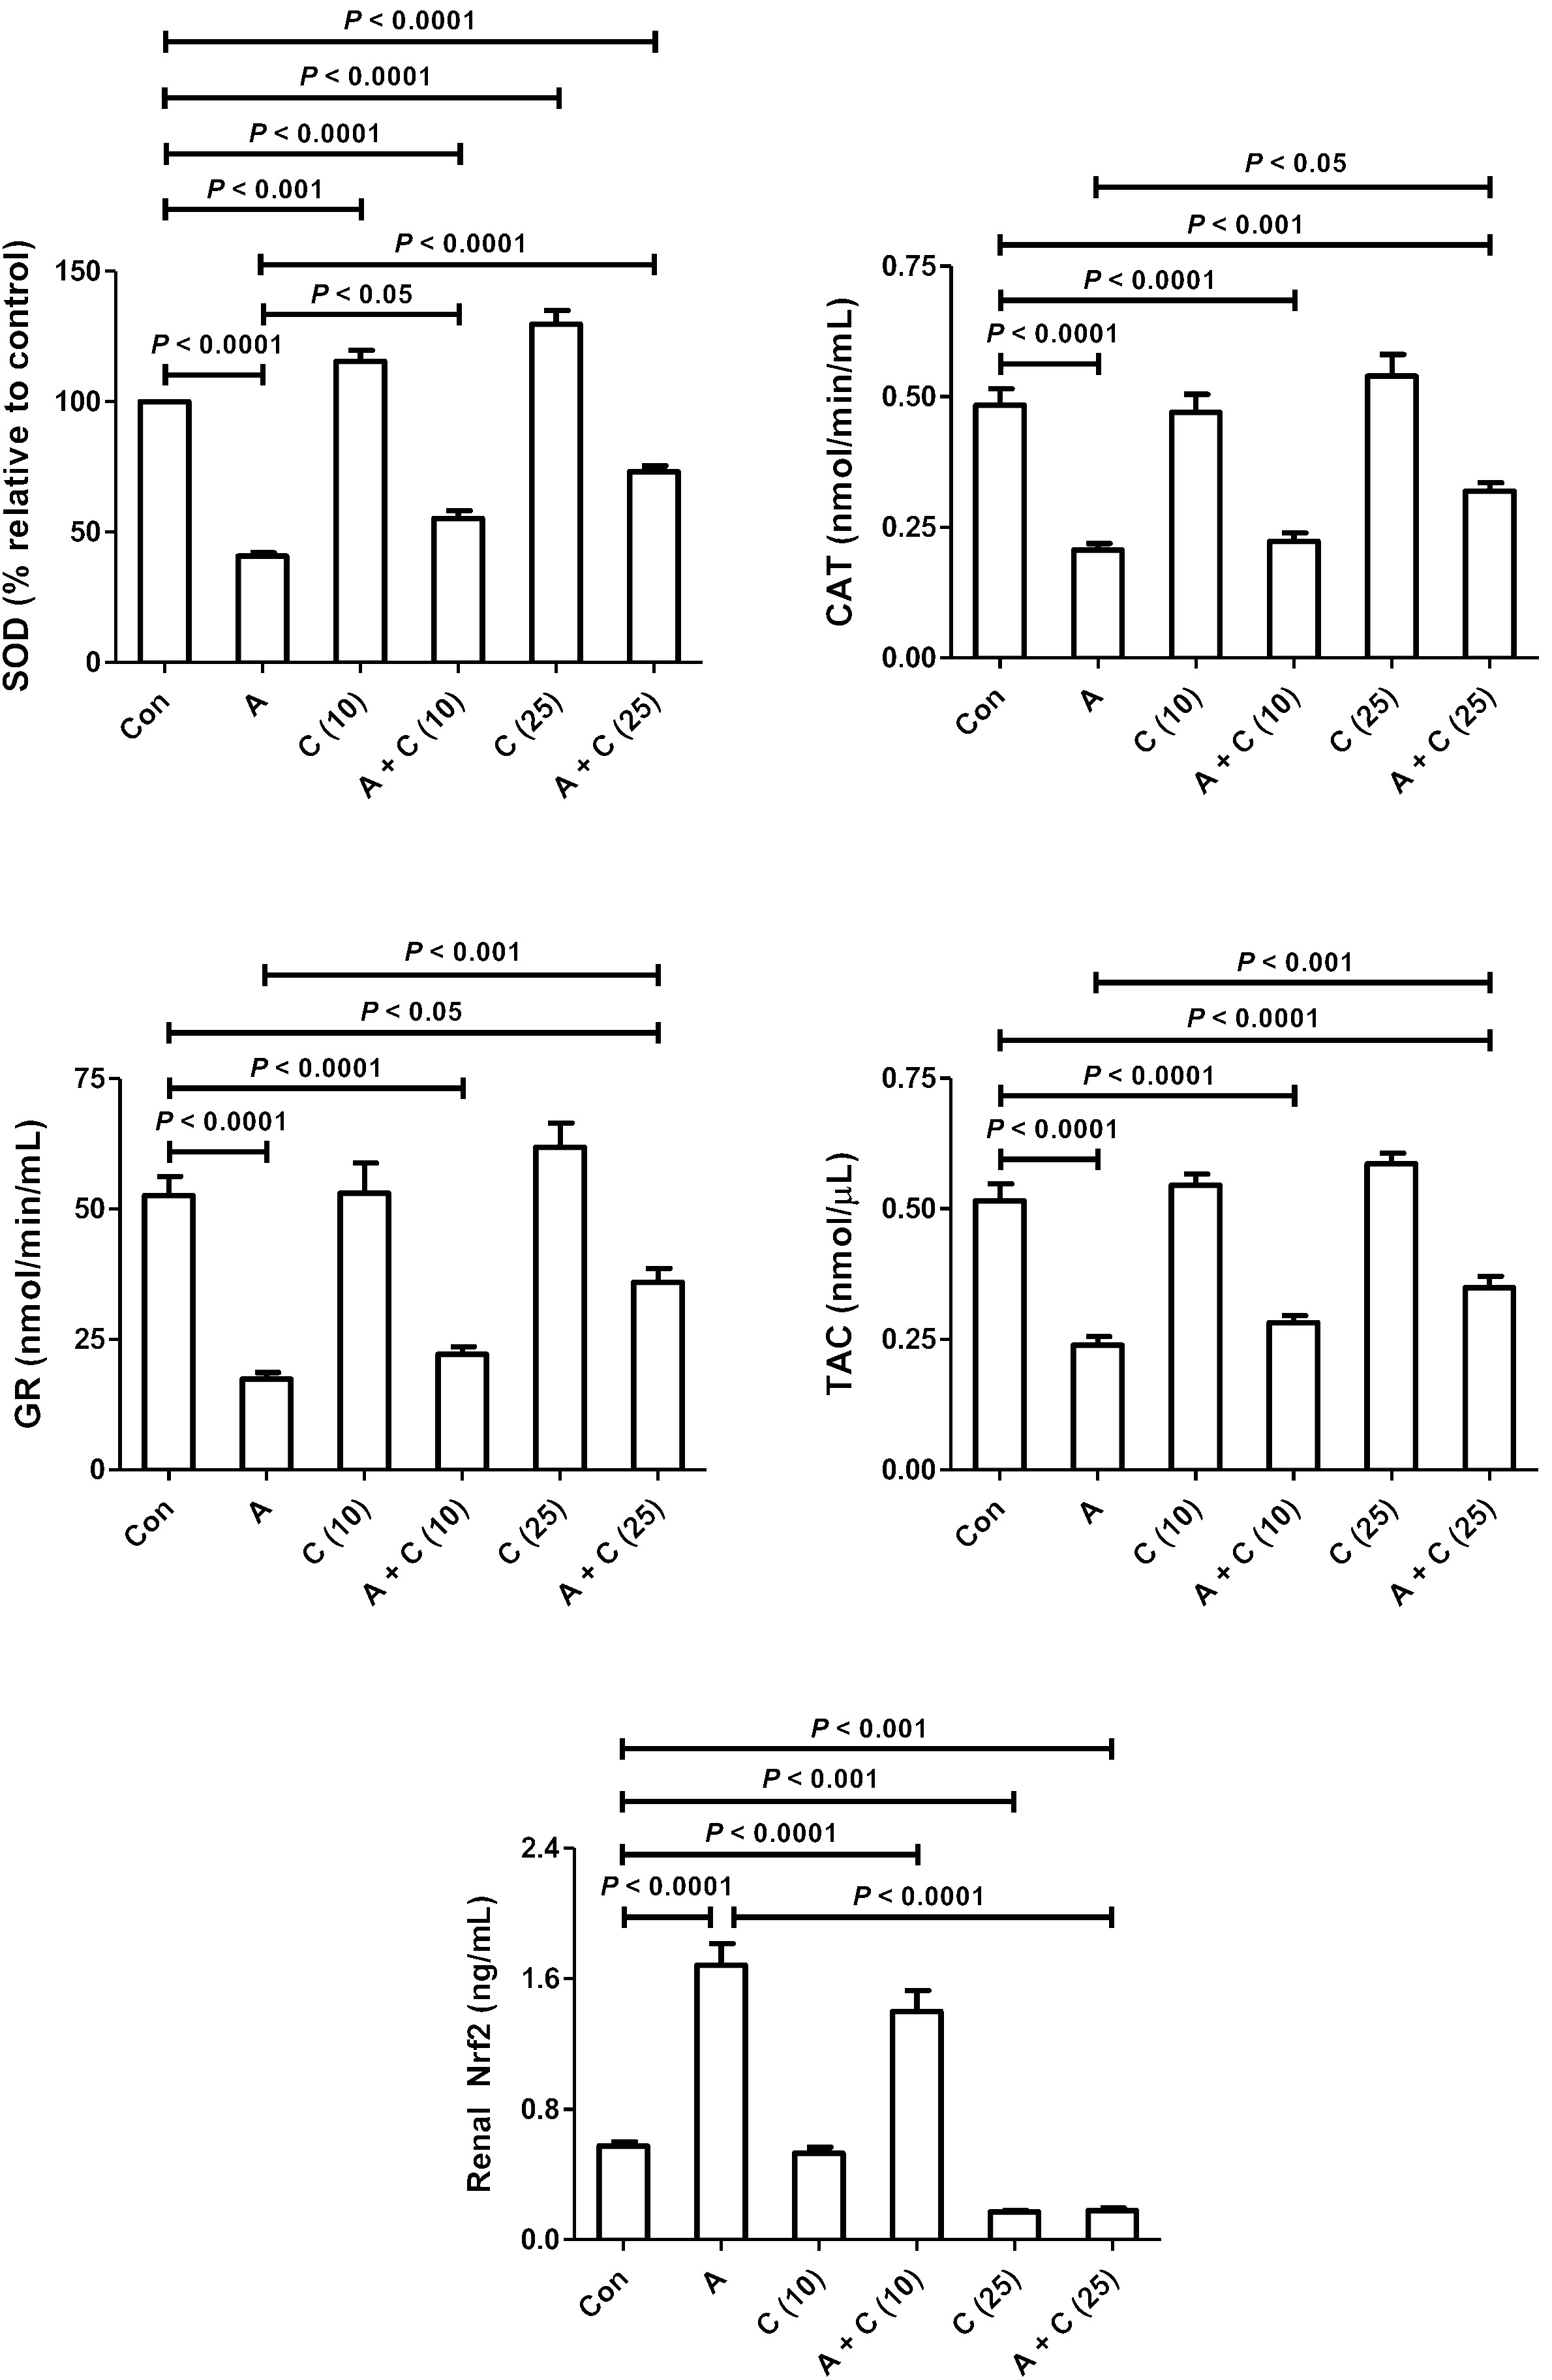
Fig. 2. Renal concentration or activity of superoxide dismutase (SOD), catalase (CAT), glutathione reductase (GR), total antioxidant capacity (TAC), and nuclear factor erythroid 2-related factor 2 (Nrf2) in control rats, rats treated with adenine (A), or canagliflozin (C), separately or in combination. Each column and vertical bar represent mean ± SEM (n = 6). Differences between the groups were assessed by one-way analysis of variance (ANOVA) followed by Bonferroni's multiple comparison test.